
ChromaGrid is a browser-based colour chip generator designed to sit at the intersection of teaching, design, and applied colour research. Built with web technologies, it turns abstract colour theory into something you can touch, rotate, and export.
Access it online at https://waqastariq.com/chromagrid
What it does
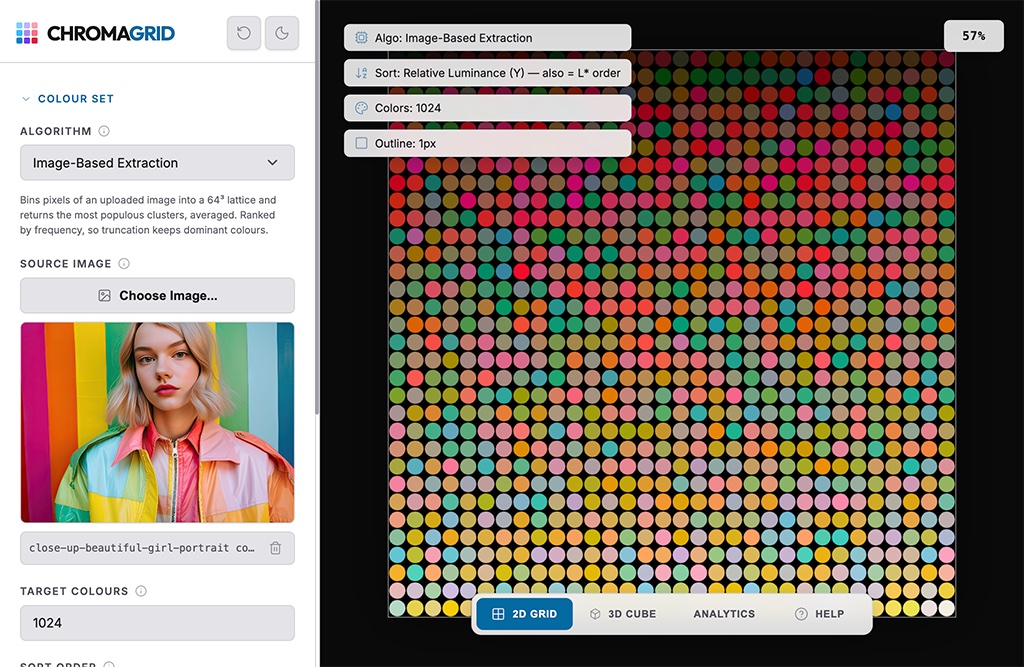
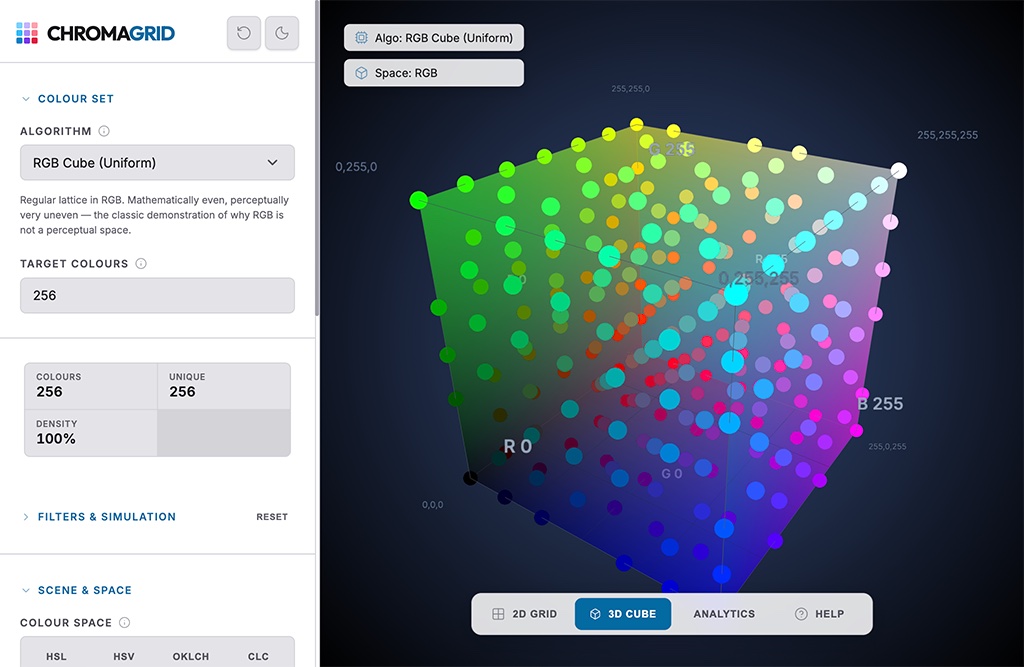
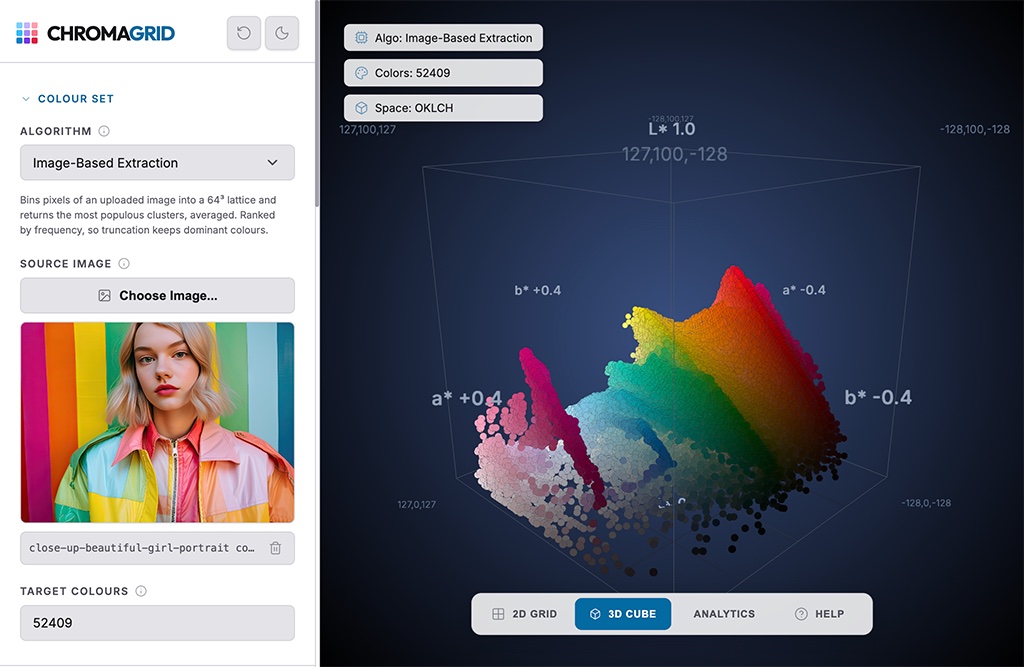
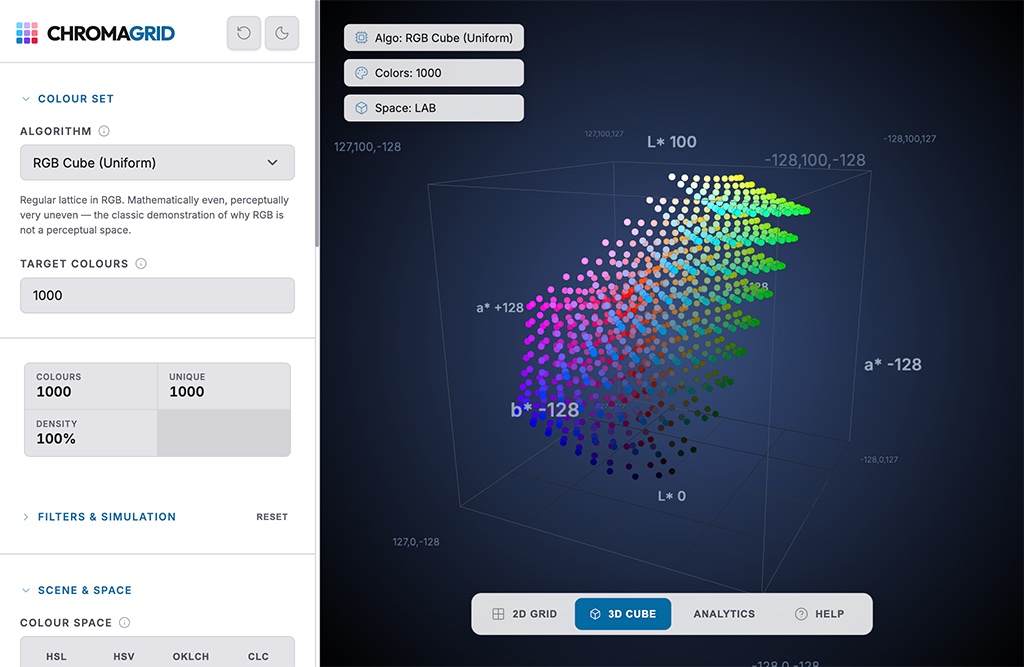
At its core, ChromaGrid generates grids of colour swatches — "chips" — using eleven different algorithms, from a classic HSL 3D Spiral and uniform RGB/LAB/OKLCH cubes, to the Visible Spectrum reconstructed from CIE 1931 colour-matching functions, to Image-Based Extraction that mines frequency-ranked, bucket-averaged palettes straight from an uploaded photo.
The result is displayed in one of four view modes:
- 2D Grid — a zoomable, pannable canvas of chips with per-swatch tooltips
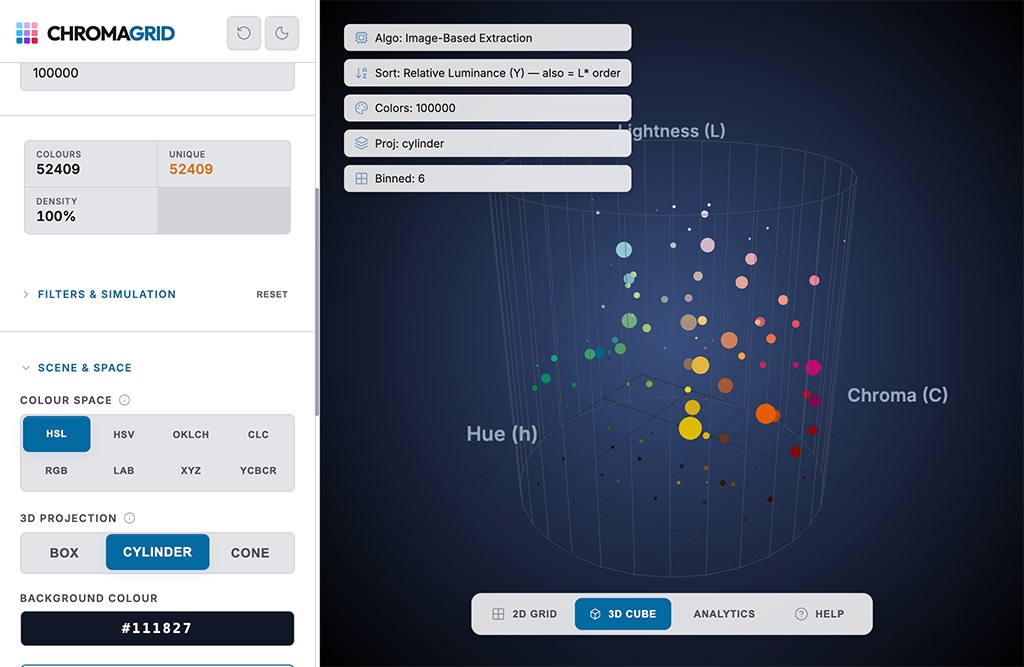
- 3D Point Cloud — an interactive Three.js scene plotting every colour inside eight different colour spaces, with box, cylinder, and cone projections
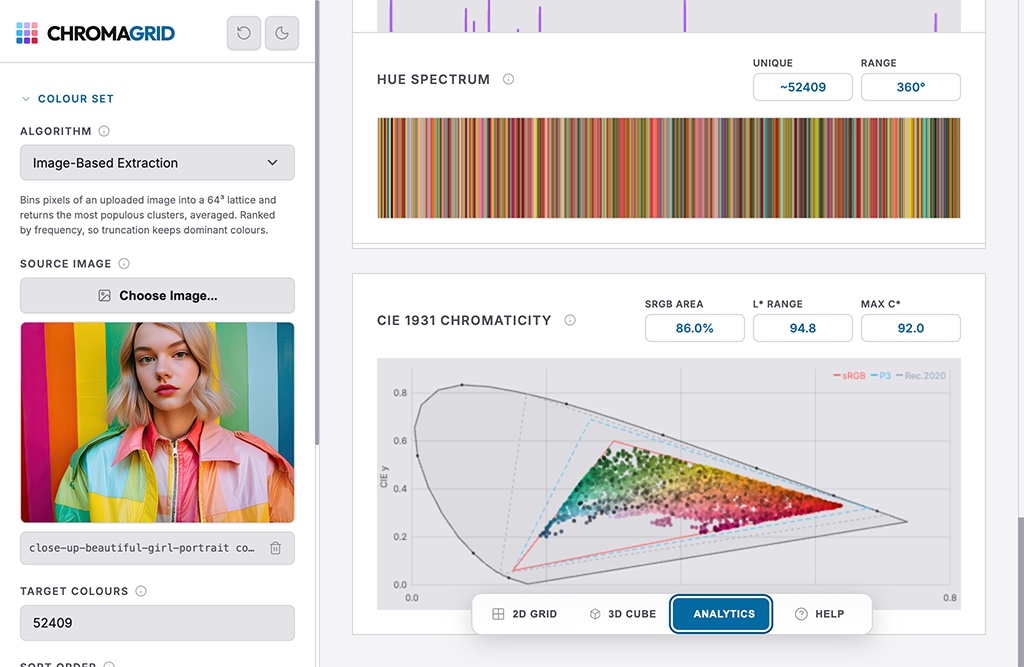
- Analytics — charts covering hue, luminance, chroma, ΔE00, correlated colour temperature, RGB distribution, WCAG contrast ratios, and a CIE 1931 chromaticity diagram
- Help — in-app documentation written as layered course material, deliberately jargon-free at the surface with collapsible technical detail for specialists
The Colour Science Underneath
ChromaGrid does not cut corners on colorimetry. All paths assume sRGB (IEC 61966-2-1), a D65 white point, and the CIE 1931 2° observer. CIELAB follows CIE 15:2004 exact constants; colour difference is CIEDE2000 verified against all 34 Sharma et al. (2005) reference pairs; colour-vision-deficiency simulation uses the Machado et al. (2009) matrices applied in linear RGB to avoid gamma errors; and WCAG contrast follows version 2.2.
The scope limits are documented honestly in-app: no ICC colour management, no 10° observer, 8-bit output only, CMYK is naive algebra rather than a press profile.
Who it is for
ChromaGrid targets three audiences in priority order. Academia first — the Help document is written as course material with plain-language primers, layered technical depth, and cited sources. Design second — palette construction, tint/shade ramps, and accessibility auditing. Research third — applied colour work on measured or extracted data.
Acknowledgements
My sincere thanks to Mr. Gulzar Ahmad, whose expert review of an early build was as exacting as one would hope from a colour scientist. He questioned which standards each figure was computed against and where those definitions actually hold — and he was right on every count. Several of the conventions ChromaGrid now follows come directly from his findings. His own work at KOLORware is well worth a look.
